什么是格拉法纳?
格拉法纳 是一个用 Typescript(前端)和 Go(后端)编写的数据可视化和监控工具,允许用户创建和编辑日志和数据图并创建指标。 与 InfluxDB、Prometheus、Elasticsearch 等时间序列数据库结合使用,Grafana 可以使用插件作为模板和现成的图表和指标。
Grafana 提供以下机会:
- 数据可视化: 允许使用许多选项和设置进行快速灵活的可视化。
- 动态仪表板: 提供使用模板化变量创建动态和可重用面板的能力。
- 指标探索: 通过拆分视图并比较不同的时间范围和来源,使用临时查询和动态钻取来探索您的数据。
- 数据日志: 为在日志中使用数据度量提供了巨大的机会,并保存了标签和过滤器,可以研究、查看和广播这些数据。
- 广泛的警报功能: 直观地为您最重要的指标定义警报规则。 Grafana 将持续评估并向 Slack、PagerDuty、VictorOps 和 OpsGenie 等系统发送通知。
- 混合数据源: 将不同的数据源混合在同一张图上并针对每个查询。
要求
- 4 GB RAM 服务器
- 2个内核
- Ubuntu 20.04
- 根用户
注意:如果您没有 root 访问权限,请使用 sudo 执行以下命令时的命令。
在 Ubuntu 20.04 上安装
安装前始终从系统更新开始。
[email protected]:~# apt update && apt upgrade -y Hit:1 https://by.archive.ubuntu.com/ubuntu focal InRelease Hit:2 https://by.archive.ubuntu.com/ubuntu focal-updates InRelease Hit:3 https://by.archive.ubuntu.com/ubuntu focal-backports InRelease Hit:4 https://security.ubuntu.com/ubuntu focal-security InRelease Hit:5 https://download.docker.com/linux/ubuntu focal InRelease Hit:6 https://packages.cloud.google.com/apt kubernetes-xenial InRelease Reading package lists... Done Building dependency tree Reading state information... Done All packages are up to date. Reading package lists... Done Building dependency tree Reading state information... Done Calculating upgrade... Done The following package was automatically installed and is no longer required: libllvm10 Use ' apt autoremove' to remove it. 0 upgraded, 0 newly installed, 0 to remove and 0 not upgraded. [email protected]:~#安装包
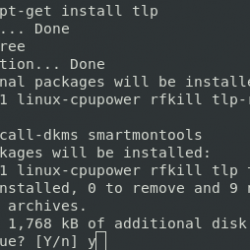
安装必要的包(apt-transport-https 和 software-properties-common)以进行正确的 Grafana 操作。
[email protected]:~# apt-get install -y apt-transport-https Reading package lists... Done Building dependency tree Reading state information... Done apt-transport-https is already the newest version (2.0.5). The following package was automatically installed and is no longer required: libllvm10 Use ' apt autoremove' to remove it. 0 upgraded, 0 newly installed, 0 to remove and 0 not upgraded. [email protected]:~#[email protected]:~# apt-get install -y software-properties-common wget Reading package lists... Done Building dependency tree Reading state information... Done wget is already the newest version (1.20.3-1ubuntu1). wget set to manually installed. Software-properties-common is already the newest version (0.98.9.4). The following package was automatically installed and is no longer required: libllvm10 Use ' apt autoremove' to remove it. 0 upgraded, 0 newly installed, 0 to remove and 0 not upgraded. [email protected]:~#将 GPG 密钥添加到受信任的密钥中。 此步骤验证下载来自预期来源。
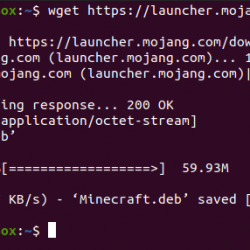
root @ host: ~ # wget -q -O - https://packages.grafana.com/gpg.key | apt-key add - OK root @ host: ~ #添加我们将安装 Grafana 的存储库。
root @ host: ~ # echo "deb https://packages.grafana.com/oss/deb stable main" | tee -a /etc/apt/sources.list.d/grafana.list deb https://packages.grafana.com/oss/deb stable main root @ host: ~ #再次更新软件包。
[email protected]:~# apt update Hit:1 https://by.archive.ubuntu.com/ubuntu focal InRelease Hit:2 https://by.archive.ubuntu.com/ubuntu focal-updates InRelease Hit:3 https://by.archive.ubuntu.com/ubuntu focal-backports InRelease Hit:4 https://download.docker.com/linux/ubuntu focal InRelease Get:5 https://security.ubuntu.com/ubuntu focal-security InRelease [109 kB] Get:7 https://packages.grafana.com/oss/deb stable InRelease [12,1 kB] Get:8 https://security.ubuntu.com/ubuntu focal-security/main amd64 DEP-11 Metadata [24,3 kB] Get:9 https://packages.grafana.com/oss/deb stable/main amd64 Packages [21,8 kB] Get:10 https://security.ubuntu.com/ubuntu focal-security/universe amd64 DEP-11 Metadata [58,2 kB] Hit:6 https://packages.cloud.google.com/apt kubernetes-xenial InRelease Fetched 226 kB in 1s (212 kB/s) Reading package lists... Done Building dependency tree Reading state information... Done All packages are up to date. [email protected]:~#Grafana 安装
现在我们可以安装 Grafana。
[email protected]:~# apt install grafana -y Reading package lists... Done Building dependency tree Reading state information... Done The following package was automatically installed and is no longer required: libllvm10 Use ' apt autoremove' to remove it. The following NEW packages will be installed: grafana 0 upgraded, 1 newly installed, 0 to remove and 0 not upgraded. Need to get 52,3 MB of archives. After this operation, 178 MB of additional disk space will be used. Get:1 https://packages.grafana.com/oss/deb stable/main amd64 grafana amd64 7.5.4 [52,3 MB] Fetched 52,3 MB in 5s (9.819 kB/s) Selecting previously unselected package grafana. (Reading database ... 166801 files and directories currently installed.) Preparing to unpack .../grafana_7.5.4_amd64.deb ... Unpacking grafana (7.5.4) ... Setting up grafana (7.5.4) ... Adding system user `grafana' (UID 126) ... Adding new user `grafana' (UID 126) with group `grafana' ... Not creating home directory `/usr/share/grafana'. ### NOT starting on installation, please execute the following statements to configure grafana to start automatically using systemd /bin/systemctl daemon-reload /bin/systemctl enable grafana-server ### You can start grafana-server by executing /bin/systemctl start grafana-server Processing triggers for systemd (245.4-4ubuntu3.6) ... [email protected]:~#接下来,让 Grafana 在启动时启动。
systemctl enable grafana-server防火墙配置
现在我们将配置防火墙(如果正在使用)。 默认情况下,Grafana 在端口 3000 上运行。我们需要使用 ufw allow ssh 和 ufw allow 3000/tcp 命令来允许访问此端口。
[email protected]:~# ufw allow ssh Rules updated Rules updated (v6) [email protected]:~#[email protected]:~# ufw allow 3000/tcp Rules updated Rules updated (v6) [email protected]:~#如果需要为特定子网打开端口,可以使用以下示例。
ufw 允许从 192.168.1.0/24 到任何端口 3000
现在使用 systemctl 命令启动 Grafana 服务。
root @ host: ~ # systemctl start grafana-server root @ host: ~ #检查状态
验证 Grafana 是否已启动并正在运行。
[email protected]:~# systemctl status grafana-server ● grafana-server.service - Grafana instance Loaded: loaded (/lib/systemd/system/grafana-server.service; disabled; vendor preset: enable> Active: active (running) since Wed 2021-04-21 20:53:08 +03; 27s ago Docs: https://docs.grafana.org Main PID: 16895 (grafana-server) Tasks: 13 (limit: 9486) Memory: 22.8M CGroup: /system.slice/grafana-server.service └─16895 /usr/sbin/grafana-server --config=/etc/grafana/grafana.ini --pidfile=/var/r> apr 21 20:53:09 host grafana-server[16895]: {"@level":"debug","@message":"datasource: registerin> apr 21 20:53:09 host grafana-server[16895]: {"@level":"debug","@message":"datasource: registerin> apr 21 20:53:09 host grafana-server[16895]: {"@level":"debug","@message":"datasource: registerin> apr 21 20:53:09 host grafana-server[16895]: {"@level":"debug","@message":"datasource: registerin> apr 21 20:53:09 host grafana-server[16895]: {"@level":"debug","@message":"datasource: registerin> apr 21 20:53:09 host grafana-server[16895]: {"@level":"debug","@message":"datasource: registerin> apr 21 20:53:09 host grafana-server[16895]: {"@level":"debug","@message":"datasource: registerin> apr 21 20:53:09 host grafana-server[16895]: {"@level":"debug","@message":"datasource: registerin> apr 21 20:53:09 host grafana-server[16895]: {"@level":"debug","@message":"datasource: registerin> apr 21 20:53:09 host grafana-server[16895]: t=2021-04-21T20:53:09+0300 lvl=info msg="HTTP Server> lines 1-20/20 (END)启动 Grafana
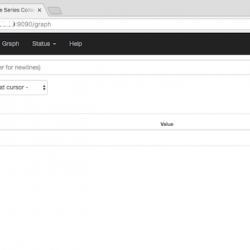
从上面的代码我们可以看到,我们的服务是活跃的,Grafana 正在工作。 现在我们可以尝试启动界面。 默认情况下,该界面将在 https://localhost:3000/ 工作,因此请在浏览器地址栏中输入。
输入默认的用户名和密码,都是 admin. 出现提示时将您的密码更新为更安全的密码。
通过本教程熟悉 Grafana Web 界面。

该教程位于 欢迎来到格拉法纳 菜单栏。

禁用新用户注册
虽然不是必需的,但建议禁用新用户的注册。 要禁用它,您需要转到 /etc/grafana/grafana.ini 路径中的配置文件。
使用您喜欢的文本编辑器来编辑文件。 在这个例子中,我们使用 纳米.
root @ host: ~ # nano /etc/grafana/grafana.ini root @ host: ~ #打开文件后,我们找到以下几行。 将 allow_sign_up = true 参数从 真的 到 错误的.
#################################### Users ############################### [users] # disable user signup / registration ;allow_sign_up = true # Allow non admin users to create organizations ;allow_org_create = true # Set to true to automatically assign new users to the default organization (id 1) ;auto_assign_org = true现在,重新启动服务。
root @ host: ~ # systemctl restart grafana-server root @ host: ~ #检查状态以确保所有内容都已保存并正常工作。
[email protected]:~# systemctl status grafana-server ● grafana-server.service - Grafana instance Loaded: loaded (/lib/systemd/system/grafana-server.service; disabled; vendor preset: enabled) Active: active (running) since Wed 2021-04-21 21:15:20 +03; 24s ago Docs: https://docs.grafana.org Main PID: 17540 (grafana-server) Tasks: 12 (limit: 9486) Memory: 18.9M CGroup: /system.slice/grafana-server.service └─17540 /usr/sbin/grafana-server --config=/etc/grafana/grafana.ini --pidfile=/var/run/grafana/grafana-server.pid --packaging=deb cfg:default.paths.logs=/var/log/grafana cfg:default.paths.da> apr 21 21:15:20 host grafana-server[17540]: {"@level":"debug","@message":"datasource: registering query type handler","@timestamp":"2021-04-21T21:15:20.442153+03:00","queryType":"grafana_api"} apr 21 21:15:20 host grafana-server[17540]: {"@level":"debug","@message":"datasource: registering query type handler","@timestamp":"2021-04-21T21:15:20.442159+03:00","queryType":"arrow"} apr 21 21:15:20 host grafana-server[17540]: {"@level":"debug","@message":"datasource: registering query type handler","@timestamp":"2021-04-21T21:15:20.442163+03:00","queryType":"annotations"} apr 21 21:15:20 host grafana-server[17540]: {"@level":"debug","@message":"datasource: registering query type handler","@timestamp":"2021-04-21T21:15:20.442168+03:00","queryType":"table_static"} apr 21 21:15:20 host grafana-server[17540]: {"@level":"debug","@message":"datasource: registering query type handler","@timestamp":"2021-04-21T21:15:20.442172+03:00","queryType":"random_walk_with_error"} apr 21 21:15:20 host grafana-server[17540]: {"@level":"debug","@message":"datasource: registering query type handler","@timestamp":"2021-04-21T21:15:20.442177+03:00","queryType":"server_error_500"} apr 21 21:15:20 host grafana-server[17540]: {"@level":"debug","@message":"datasource: registering query type handler","@timestamp":"2021-04-21T21:15:20.442181+03:00","queryType":"logs"} apr 21 21:15:20 host grafana-server[17540]: {"@level":"debug","@message":"datasource: registering query type handler","@timestamp":"2021-04-21T21:15:20.442185+03:00","queryType":"node_graph"} apr 21 21:15:20 host grafana-server[17540]: {"@level":"debug","@message":"datasource: registering query type fallback handler","@timestamp":"2021-04-21T21:15:20.442191+03:00"} apr 21 21:15:20 host grafana-server[17540]: t=2021-04-21T21:15:20+0300 lvl=info msg="HTTP Server Listen" logger=http.server address=[::]:3000 protocol=http subUrl= socket= lines 1-20/20 (END)您现在已成功限制用户注册。
结论
今天我们学习了如何在 Ubuntu 20.04 上安装 Grafana。 Grafana 现在是最流行的图形监控工具之一,拥有令人难以置信的功能,如数据可视化、动态仪表板和广泛的警报功能。
正在寻找高性能托管解决方案? 查看我们的 Cloud 今天的服务器!